
May 25, 2021
As the German federal government and state governments publicize plans for reopening the country, it seems like one phrase is everywhere: incidence rates.
Incidence rates are how the Robert Koch Institute (RKI), which is the German equivalent to the Centers for Disease Control and Prevention, measures COVID risk. Essentially, the RKI uses an “incidence rate” of 50 cases per 100,000 people, as measured in a 7-day period, as the minimum risk threshold for Germany. So, any number below 50 is, generally speaking, a good thing.
In fact, many reopening plans are tied to incidence rates of 50 cases per 100,000 or 100 cases per 100,000. In short: as the case count drops, the ability to open things up increases.
As interested parties, then, it is helpful to be able to know where incidence rates are at a given point in time. Fortunately, the RKI offers an excellent online tool that allows an almost real-time look at case counts in Germany: https://experience.arcgis.com/experience/478220a4c454480e823b17327b2bf1d4/page/page_1/.
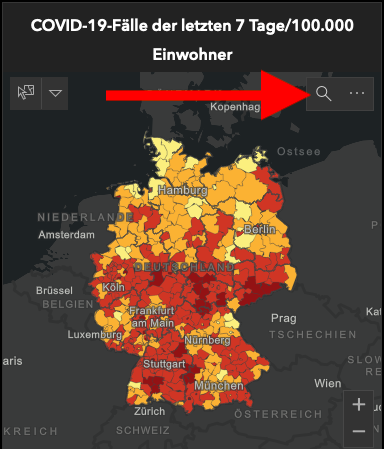
For the moment, it only exists in German, and looks like this. But fear not! Navigating it is very simple, especially with this handy guide. Here’s what you need to know.
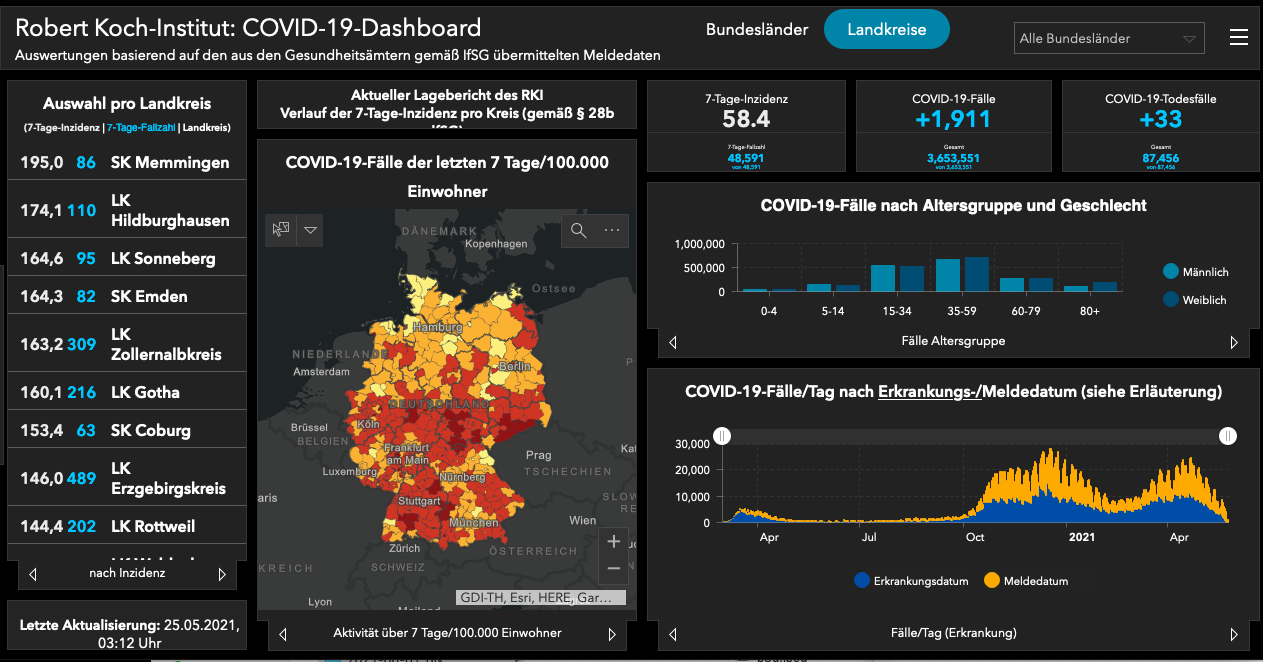
Choose your view: States, counties and cities
In the top right portion of the page, you’ll see these three options, which give you the choice of what sort of view you want.
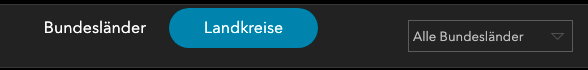
Here’s a quick guide to understanding the three primary options.
- Bundesländer = state. Selecting this option allows you to view the incidence map at a state level.
- Landkreise = county. Selecting this option allows you to view the incidence map at a county (i.e. much more specific) level.
- Alle Bundesländer = all states. This is where you can select the state you want, in order to get a more granular view of what’s happening where you live. Key states for U.S. personnel in Germany are Rheinland-Pfalz (home of the KMC and Baumholder), Hessen (home of Wiesbaden), Baden-Württemberg (home of Stuttgart), and Bavaria (home of USAG Bavaria and Ansbach).
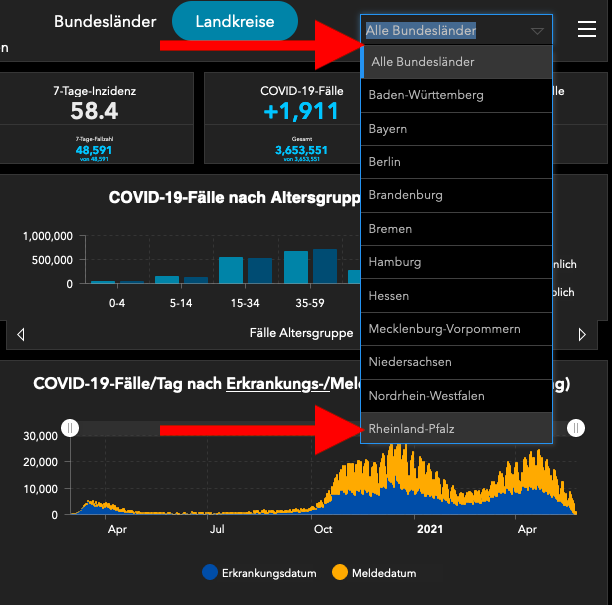
Know your stats: Incidence rates, case counts and deaths
The following bar, which is front and center on the tool used by the RKI, offers three important and easy-to-understand metrics. Since “Rheinland-Pfalz” has been selected as the primary option to view, all statistics are only applicable to that state.
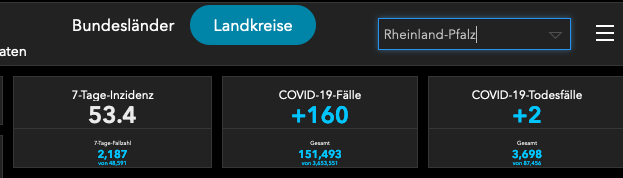
The three primary statistics can be translated as the following.
- 7-Tage Inzidenz = incidence rate. In this case, the overall Rheinland-Pfalz rate is 53.4.
- COVID-19 Fälle = COVID-19 cases. In this case, there have been 160 new cases recorded in the last 7 days.
- COVID 19 Todesfälle = COVID-19 deaths.
Digging more deeply
If you want to get more granular, this tool allows for it it. First of all, you can zoom in more closely on the large scale map.
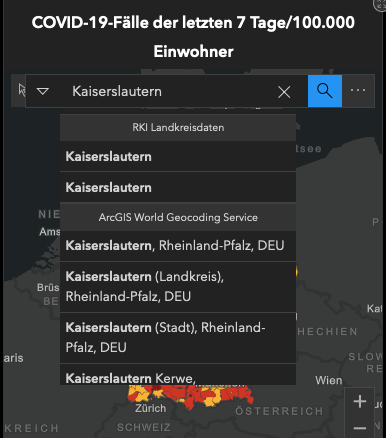
Then type in the state or city in which you’re interested. For example, KMC residents may be interested in Kaiserslautern.
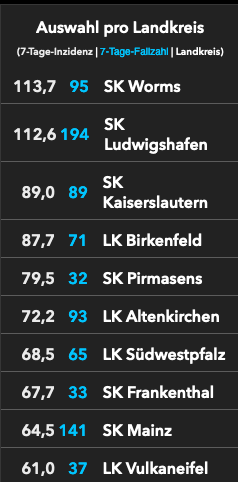
You can also get a closer look at the cities and counties in your state by scrolling the county and city list on the left side of the page. A quick note: SK = Stadtkreise = urban area. This allows the RKI to get a closer look at what is happening in larger cities.
Additional Resources
For an extensive listing of COVID-19 resources in English, please visit https://www.finditguide.com/covid-19-info.
For U.S. government employees, including service members, remember to always follow command regulations, which may be different than host nation policies.